How Does ncIMPACT Initiative Use Metrics?
In this blog, we are pulling back the curtain on ncIMPACT Initiative’s internal metrics framework – why and how we measure what we do and how we use that data to direct our work.

Co-Author: Jessica Dorrance
We are all becoming data experts. For the past two years during the COVID-19 pandemic, many of us monitored data like never before. The data have helped guide decisions from federal policies and funding all the way down to household and individual decisions about how we choose to interact with society and family.
Using data can provide transparency, precision, and standardization in decision-making. Data can be transformed into metrics, which are used to measure progress toward goals and provide clear indications when performance is not on track.
In this blog, we are pulling back the curtain on ncIMPACT Initiative’s internal metrics framework – why and how we measure what we do and how we use that data to direct our work – starting from the very beginning.

The ncIMPACT Initiative Origin Story
The UNC School of Government is the largest university-based local government training, advisory, and research organization in the United States, so when ncIMPACT Initiative launched in 2017 as an entrepreneurial venture within the School, it focused directly on serving the communities North Carolina’s local officials lead.

The ncIMPACT Initiative team used the same methodology to determine how their work would be most effective that we use in all our program development – we collected a lot of data by asking questions and then carefully analyzed the answers.
In response to a clear call for more data from trustworthy sources that is accompanied by explanatory narratives, the ncIMPACT Initiative has spent the last five years digging into and sharing data about complex challenges facing North Carolina communities.
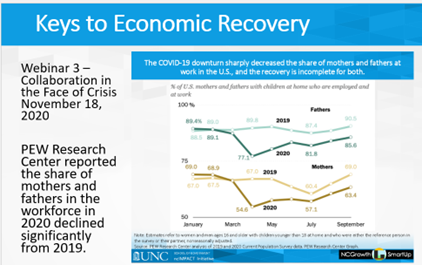
As one example, the ncIMPACT Initiative, together with NCGrowth, collected extensive statewide data about economic impacts of COVID-19 and shared them in webinars, case studies, and other resources in the Keys to Economic Recovery from COVID-19 project.
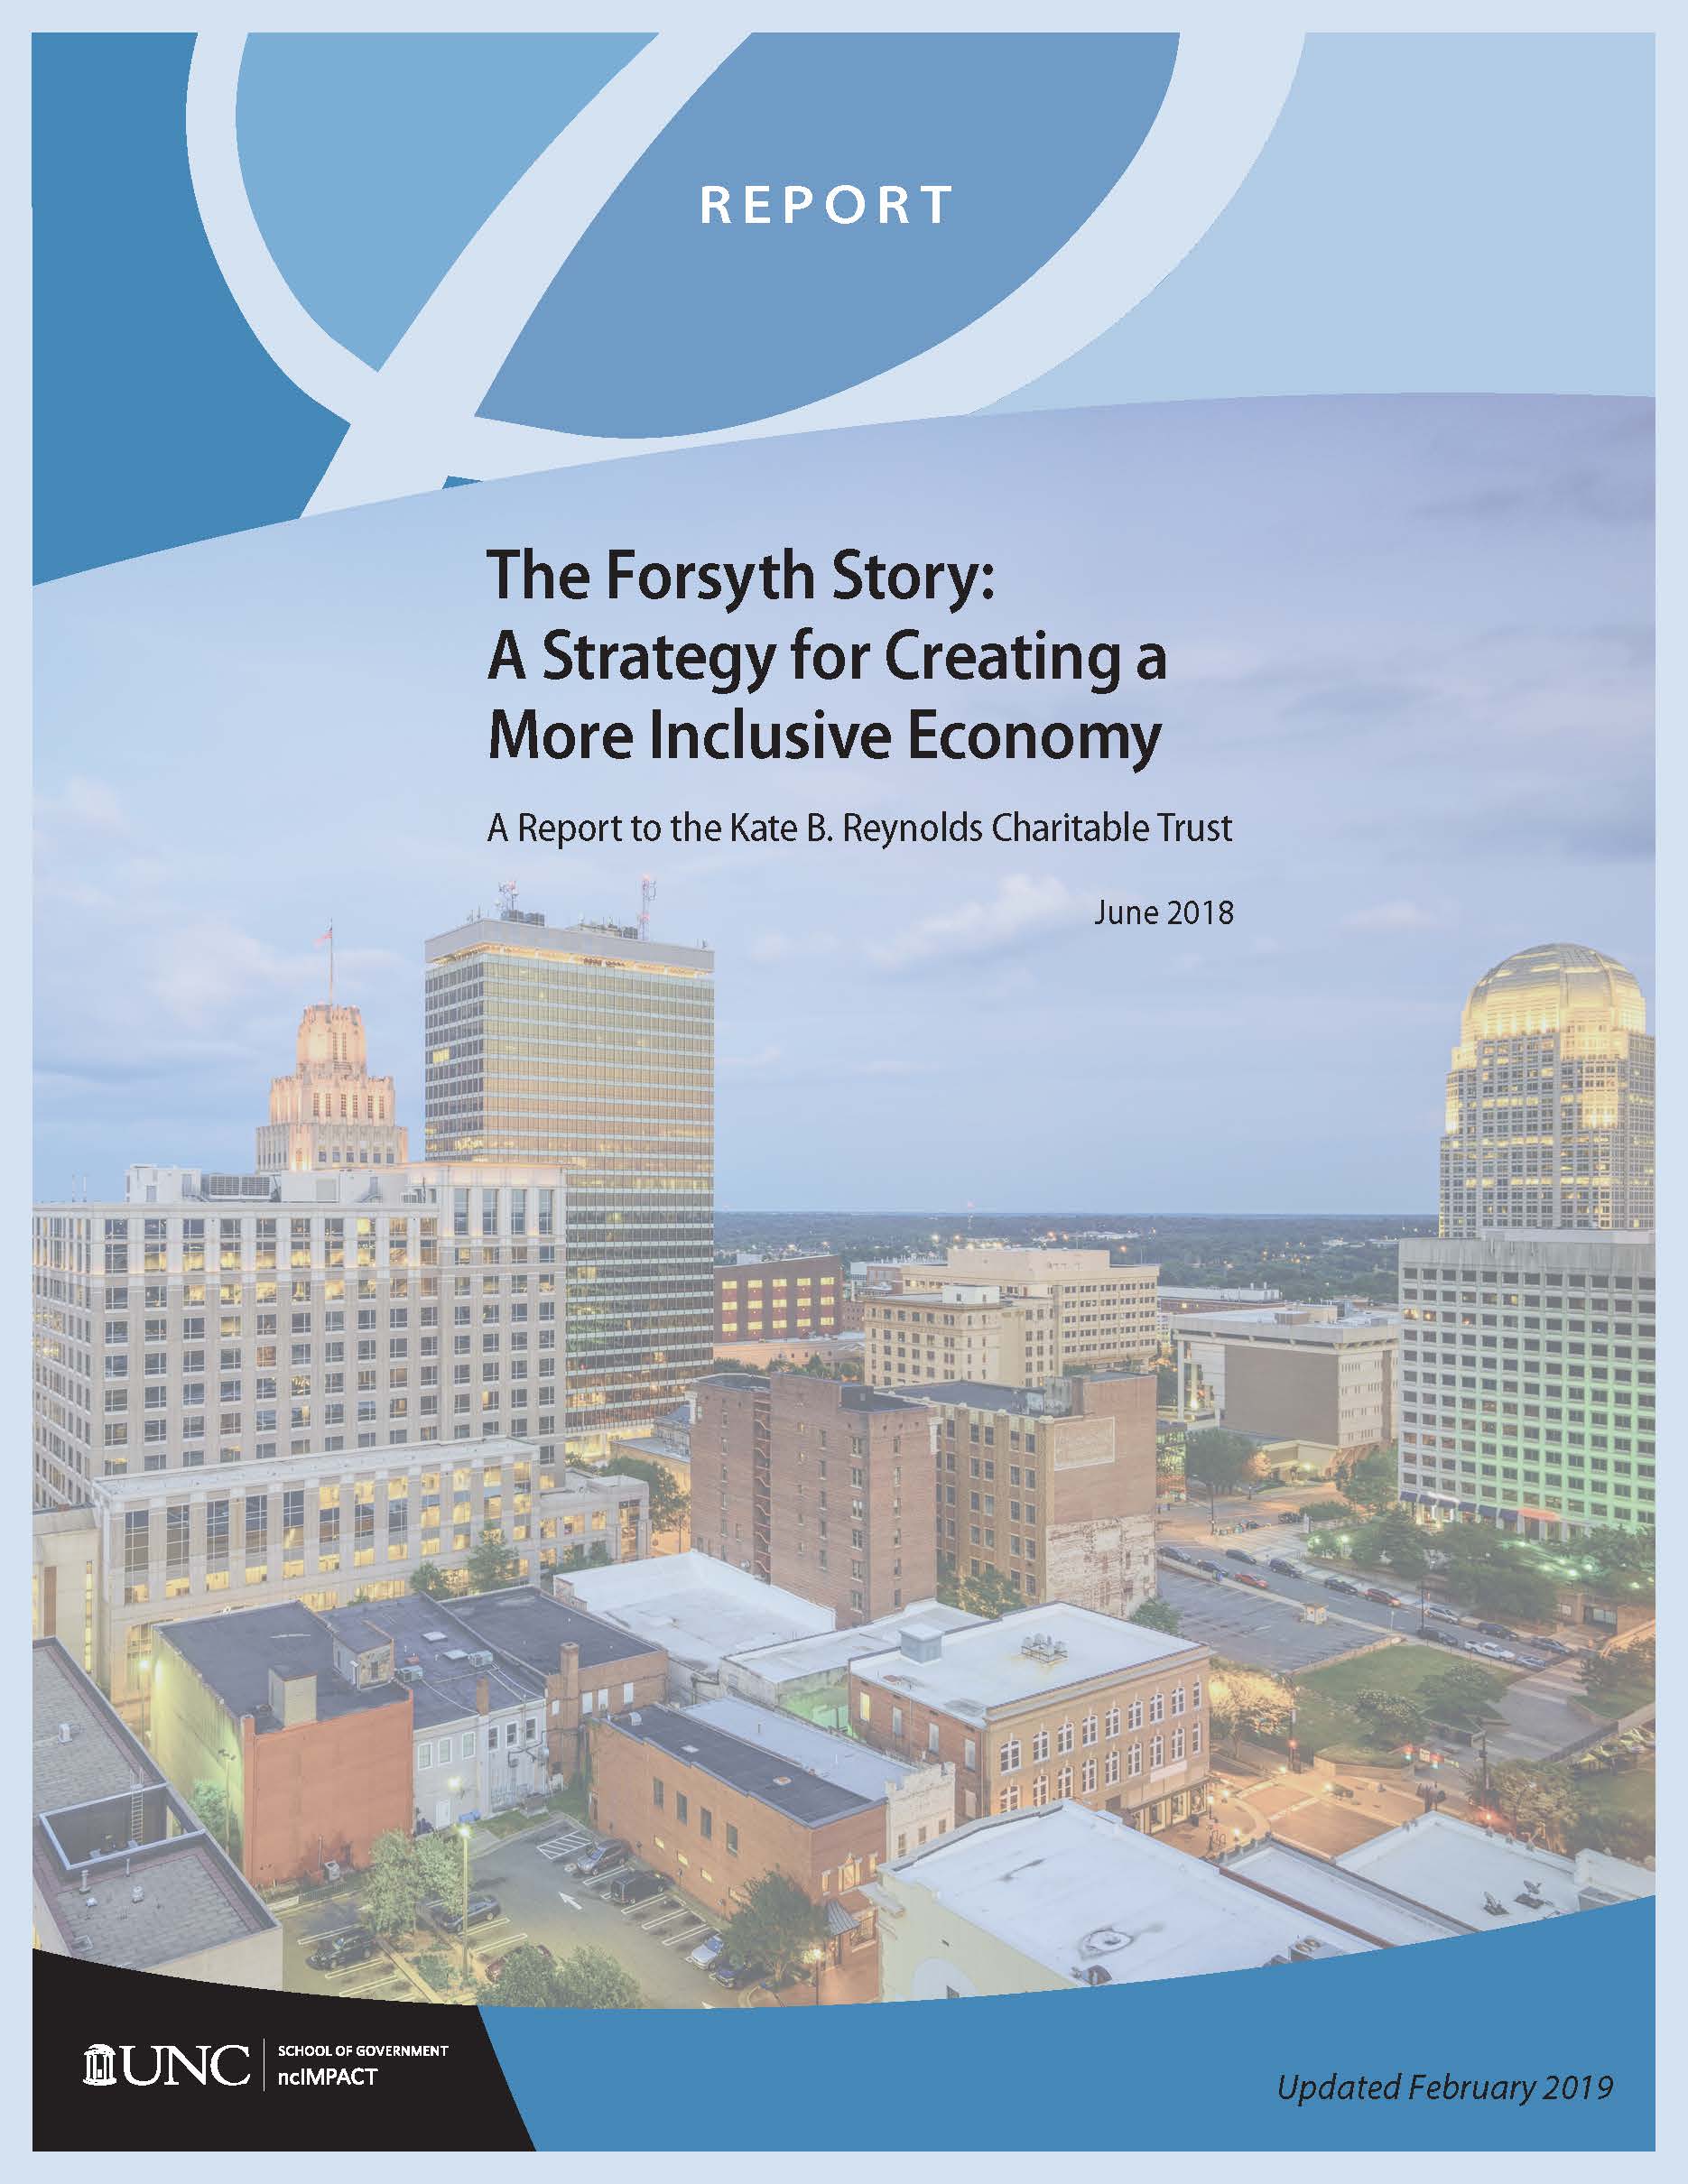
In another example, we collected data from focus groups in Forsyth County as we sought to help community stakeholders think differently about ways to address economic mobility. The result was a report that offered a comprehensive strategy for creating a more inclusive economy.
Our Guiding Strategies
In addition to providing data for and about North Carolina, ncIMPACT Initiative collects and uses data to set our internal performance goals and metrics, track progress towards those, and inform the actions necessary to meet our mission.
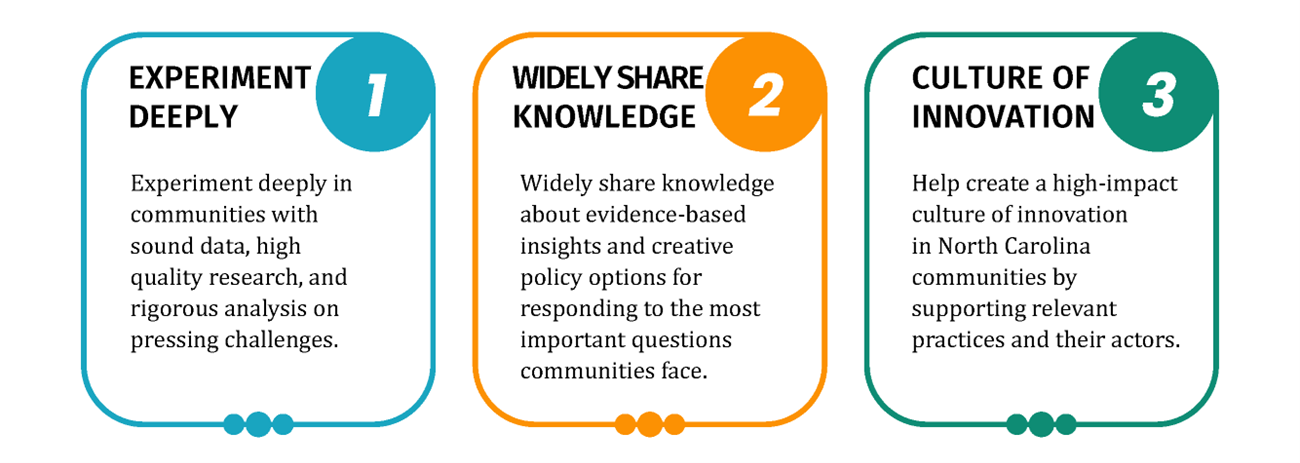
We structure our work, including our metrics, around three guiding strategies: Experiment Deeply, Widely Share Knowledge, and Create a Culture of Innovation. Using metrics helps us know if our efforts are tracking with those strategies.
How Our Process Works
Every summer during our team retreat, we collectively decide on our annual performance goals and what data we want to track to assess our progress. Then, we align those metrics with each of our three strategies mentioned above. At the end of each quarter, we analyze the raw data for each of the categories we are tracking. One of our talented former UNC MPA student workers created a comprehensive Excel workbook where we input all that data on multiple sheets. Our metrics subgroup within our team collaborates to create a report that highlights the strengths and struggles of that quarter’s metrics and how we’re performing year-to-date.
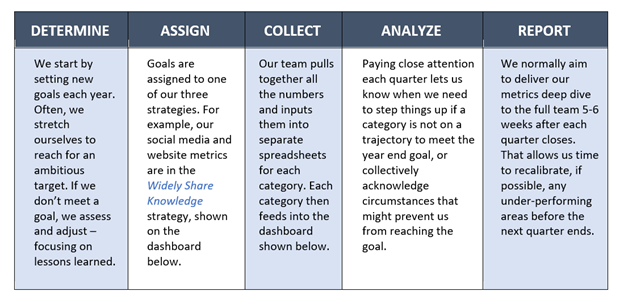
The snapshot of our dashboard below provides a look at activities we’ve identified that align with our strategies. The information is tracked by quarter. We assess our progress as we move through the year. We ask ourselves: Are we on pace, have we already exceeded our expectations, or are we missing the mark?
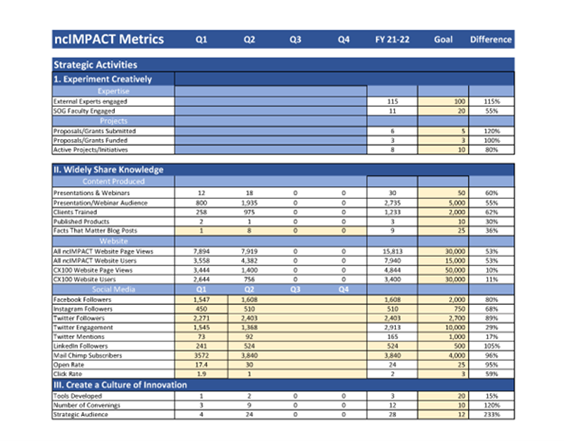
ncIMPACT Initiative Metrics Dashboard
Applied Metrics – How the Data Guides Our Work
Let’s look at one example that illustrates how we apply our metrics to guide our work. Under our Widely Share Knowledge strategy, you can see our Facts That Matter blog posts as the last line item under the Content Produced subhead on our dashboard above. We’ve reproduced the essential elements below, to simplify things. Notice that our goal is to have 25 blogs published within the fiscal year (FY). Now, take a look at how many blogs were published in the first quarter. We were at 10% of our YE (year-end) goal at the end of Q1 (Quarter 1). You can see that this was an impetus for us to really step up our game in Q2. We are just now beginning to collect data for Q3 and early indicators of only 5 blogs could be cause for some concern if projections didn’t show we would have at least 13 blogs published during Q4, which will bring us over the top of our YE goal.
![]()
![]()
Decisions can only be as good as the data upon which they are based. Knowing how to use the data to tell you what you need to know may help ensure you get where you want to go. Tailoring what you collect to match your organizational goals is crucial.
Research and Data are in Carolina’s DNA
While we’ve focused this blog on ncIMPACT Initiative’s tailored approach to metrics, it aligns with the University of North Carolina at Chapel Hill’s overall culture of using data to inform and guide actions, determine goals, identify gaps, make new discoveries, and spark innovations. In fact, Carolina’s Chancellor, Kevin Guskiewicz, recently wrote about the use of data and metrics in his weekly message to the campus. He highlighted just a few of the metrics that the University deems essential to track, and stressed the need to strive to set ambitious goals. Most importantly, he encouraged us all to think about not just the numbers, but the people behind every data point whose lives will be affected and improved by our decisions and actions.

We’d love to hear your data and metrics stories!
Now that we have shared some of ncIMPACT Initiative’s metric collections and data-driven decision making processes, we want to know more about yours. Share some of your examples, successes, nightmares, or cautionary tales on our Twitter or LinkedIn feeds to help others learn and generate new ideas!