After-School Staff as Potential Public Health Information Channel
Network analysis reveals gaps via network density and fragmentation metrics and key actors via degree centrality and betweenness centrality metrics. This information can better inform public administrators on how to disseminate information about public health resources and services through after-school staff.

The Challenge
From vaccine recommendations to COVID-19 safety guidelines, the American public has become more skeptical of public health information and resources in recent years. Due to changing public opinion, public health leaders are trying to adapt and reach diverse populations. Administrators and public health officials have traditionally measured output metrics (e.g., program participants, vaccines administered, doctors’ visits, and medical procedures performed) to assess the success of public health information dissemination. While these output metrics are essential to understanding which demographics are likely to respond to public health information, more research should study how information travels and which demographics aren’t receiving reliable information from their trusted sources.

The Solution
Social capital is the connections, networks, and relationships among people and the value that arises from them. Information channels, or how people receive information, are a key component of a person’s social capital. When viewing social capital from a network approach, resources reside within the structure of a social network and between actors, not within the individual. Therefore, network mapping and analysis can inform social network interventions to better meet the needs of a target group (e.g., underserved and historically marginalized populations). Research by Carolyn Barnes and Sarah Nolan shows that after-school staff members act as professionals, friends, and confidants to parents. Because after-school staff provide social support to parents through informational aid, these staff members can play an important role in disseminating public health information. Using the network approach, the following method can help measure and quantify social capital in the context of after-school staff and information channels for public health services and resources.
- Compile a list of after-school programs in a given county and contact information for each program’s staff.
- Send a Qualtrics survey to individual staff members asking about the following topics:
- Knowledge and awareness of public health resources and/or services
- Frequency of connecting children and/or parents with public health resources and/or services
- Level of education or professional experience in public health
- Individuals and/or organizations that are their sources of public health information
- Use a snowball method to contact the information sources mentioned in previous survey responses.
- Transform the information sources responses into a matrix compatible with UCINET, a social network data analysis software, and NETDRAW, a network visualization software. For more information on how to use UCINET and NETDRAW, please consult the Quick Start Guide.
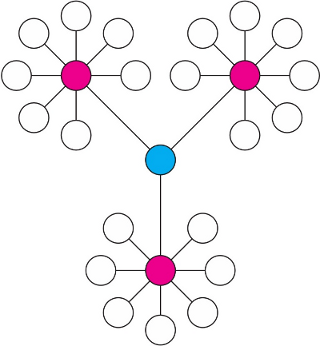
- Use NETDRAW to visualize the network.
- Use UCINET to analyze the network and assess network density, fragmentation, degree centrality, and betweenness centrality.
Network Density: To determine network completeness, network density calculates the portion of potential connections in the network compared to the actual connections present in the network.
| NETWORK DENSITY | ||||
| 0 | Between 0 and 1 | 1 | ||
| No relationships present – develop new relationships | Some relationships present – leverage existing and new relationships | All relationships present – build upon existing relationships | ||
|
||||
Fragmentation: To identify holes in a network, where new connections may be made, and potential interventions, examine the network’s fragmentation. Fragmentation is the proportion of the pairs of nodes that cannot reach each other, so lower fragmentation is ideal. If network-level fragmentation is zero, all pairs of nodes or actors can reach each other directly. Fragmentation can also be observed at the individual node level. For example, suppose the fragmentation of each node is zero. In that case, the network-level fragmentation score with all nodes present is the same as the network-level fragmentation score when that single node is removed.
Degree Centrality: Degree centrality counts the number of direct lines or relationships for each actor. A higher degree of centrality suggests that the stakeholder is more popular and possesses more social capital. In terms of after-school staff and public health information, a high degree of centrality highlights individuals or organizations that should be educated and encouraged to act as a messenger to share information with other actors within the network.
Betweenness Centrality: Betweenness centrality measures how often a node or actor is on the shortest path between two actors. This calculation becomes increasingly difficult as the network expands to more actors. Hence, tools such as UCINET are helpful because they can quickly and accurately calculate the betweenness centrality of each node. Higher betweenness centrality suggests that the actor is important to the flow of information between actors within a network and can potentially act as a broker.
The Players
- Administrators and Public Health Officials: These leaders are responsible for ensuring that information about public health resources and services is shared and reaches diverse populations, so conducting this research can better inform them on how to do this and where current processes are lacking.
- After-school Staff: Leveraging after-school staff and their existing relationships with parents, administrators, and public health officials can empower informed staff members to help parents and children within their social networks.
- Parents and Children: Analysis and research can help public information and resources reach many families, resulting in more informed parents and healthier children.

The Promise
Network analysis reveals gaps via network density and fragmentation metrics and key actors via degree centrality and betweenness centrality metrics. This information can better inform public administrators on how to disseminate information about public health resources and services through after-school staff. After such analysis, administrators and public health officials should be able to answer the following questions:
- Are there social capital connections between after-school staff and parents that are or can be utilized to increase public health education?
- Are there any gaps in the flow of public health information to after-school staff?
- Which information messengers and brokers should public administrators target to disseminate educational public health information better?